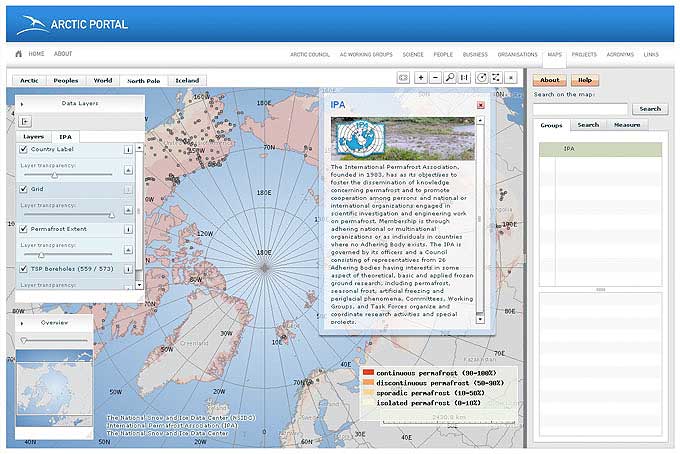
Interactive Polar Data Maps
The Arctic Portal Mapping System is to provide visual geographical information about Arctic related data, such as distribution of vegetation data, permafrost, spread of indigenous languages and information about Arctic affiliations and organizations.
The Arctic Portal Mapping System is powered with the Inter-map mapping system. Inter-map is a graphical, interactive information and communication system. An online mapping tool coupled with a database that enables non-tech administrators to quickly and easily associate and update any type of information related to any single part of a map or plan thus enabling visitors to a website to observe and obtain this information instantly. Inter-Map is a digital map content management system (DM-CMS) that can act as a stand-alone system or as part of a larger content management system.
Arctic Ocean Map and Bathymetric Chart
Within the last few years a significant amount of interest has developed in the Arctic Ocean and its features. Three factors are important in driving this new level of interest in the Arctic. First, an enormous amount of oil, natural gas and other resources are thought to be held within the Arctic Ocean’s floor. The United States Geological Survey estimates that up to 25% of the world’s remaining oil and natural gas resource might be held within the Arctic Region. Second, global warming is starting to reduce the extent and thickness of the Arctic’s sea ice. If the current trend continues, the Northwest Passage might be open to standard ships during summer within the next couple of decades and the Arctic could be ice-free in summer by midway through the current century. Third, the 1982 United Nations Convention on the Law of the Sea allows nations to extend their coastal economic zone beyond 350 nautical miles – if they can acquire scientific data that demonstrates that additional areas are a natural extension of their continent. Many nations are fielding scientific missions in hopes of extending their Arctic opportunities. For more information see: Who Owns the Arctic?
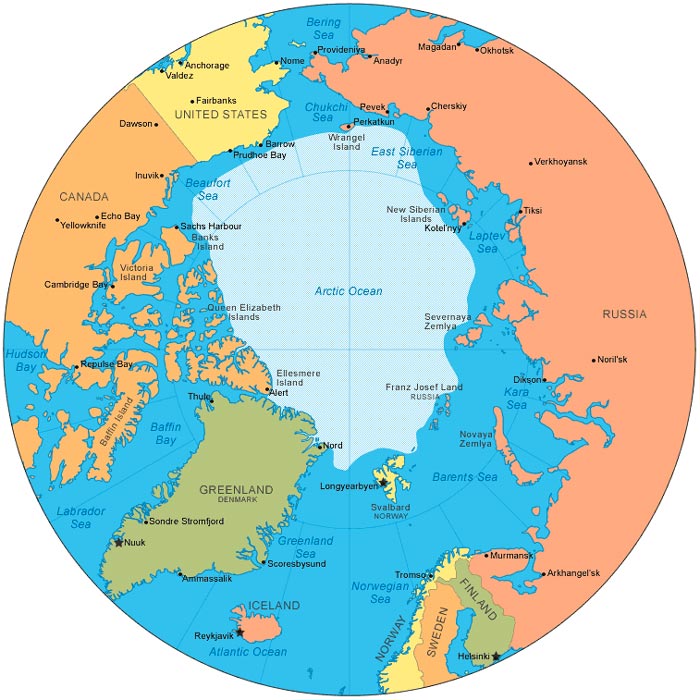
The map above was produced by Brad Cole of Geology.com using data licensed from Map Resources. It illustrates the Arctic Ocean and bordering countries. It also shows the Arctic Circle and minimal extent of the summer sea ice cover. Shown below is the International Bathymetric Chart of the Arctic Ocean which was produced by a team of investigators from Canada, Denmark, Germany, Iceland, Norway, Russia, Sweden, and the USA. It can be considered a “physical map of the Artic Ocean” as it shows the bathymetry, ridges and basins that are part of this important area.
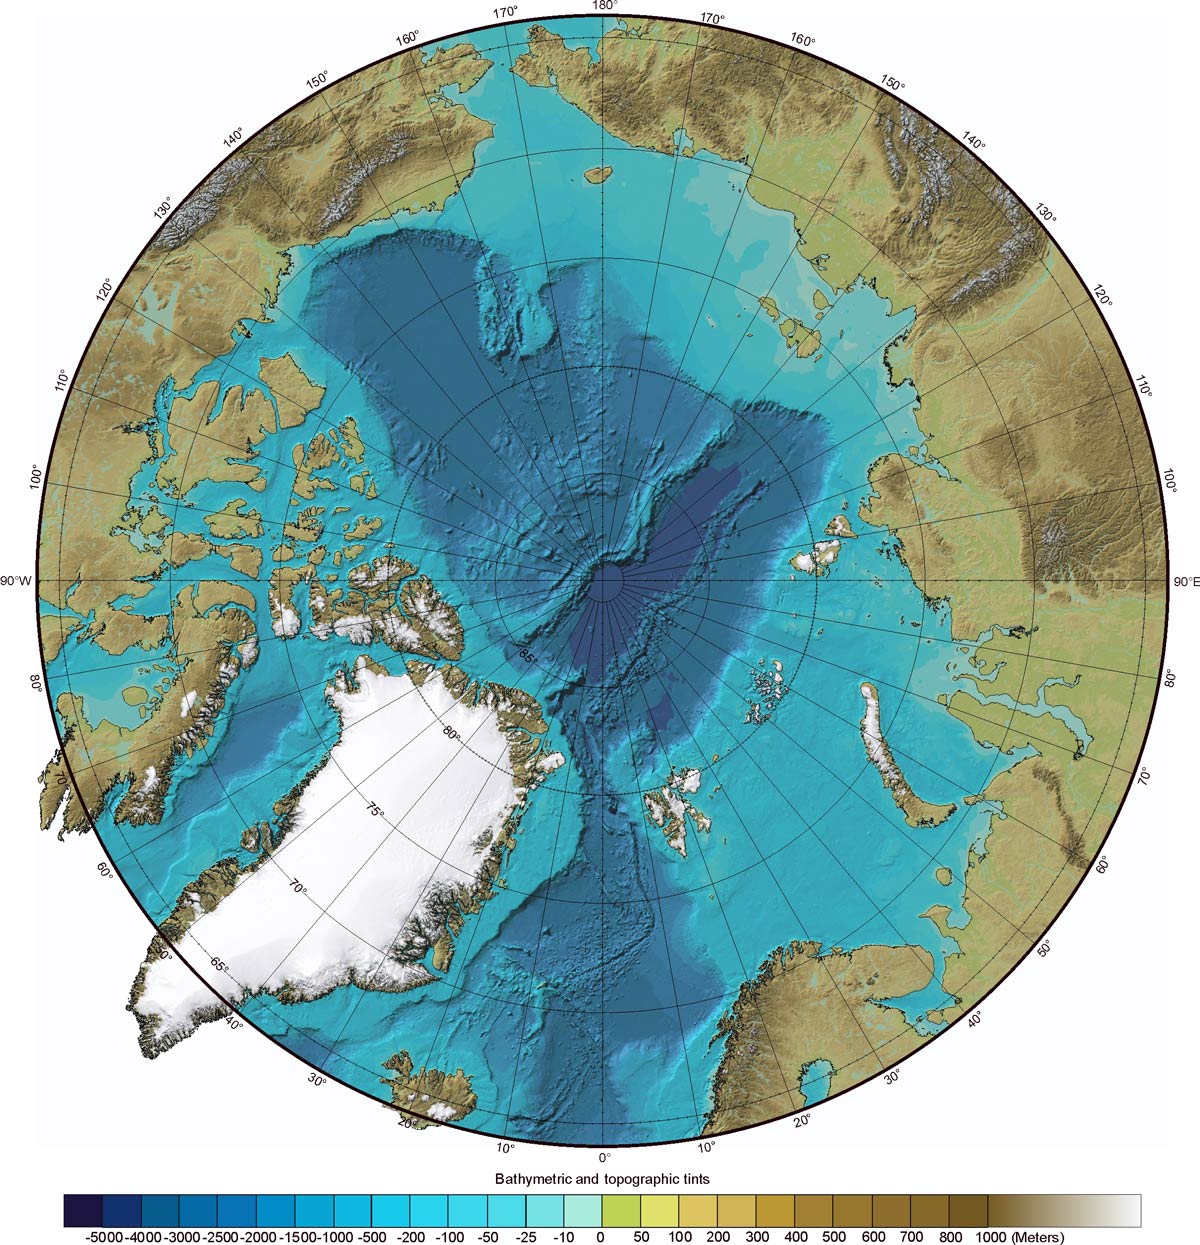
The International Bathymetric Chart of the Arctic Ocean was produced by investigators representing the Intergovernmental Oceanographic Commission (IOC), the International Arctic Science Committee (IASC), the International Hydrographic Organization (IHO), the US Office of Naval Research (ONR), and the US National Geophysical Data Center (NGDC).